
Generate customized graphics using this data by selecting one of the options below.
Related Products
Updated Health Data Sets on State Health Compare: Explore Health Statistics and Health Data Visualizations
SHADAC’s public health research fellows and analysts consistently update measures on State Health Compare (SHC) in order to provide users with the most up-to-data available data. In this post, we will review the health data sets and measures that have been updated since our last measure update blog, including a short explanation of the measure and its data source.
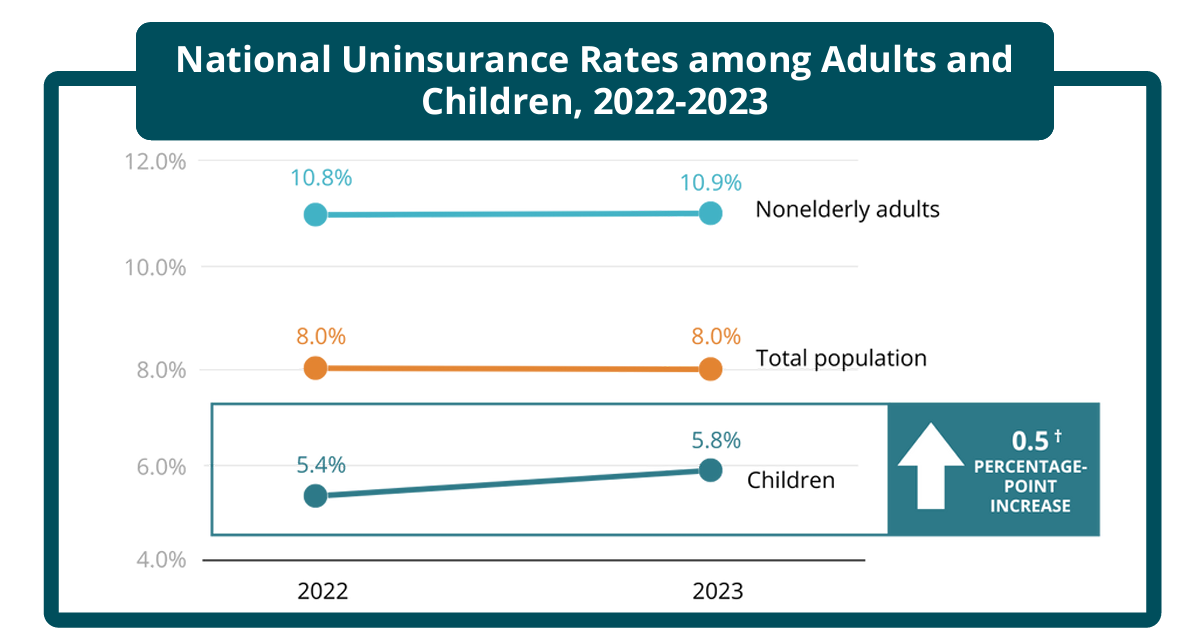
CPS ASEC: 2023 National Health Insurance Coverage Estimates Remain Steady for Adults but Rise for Children
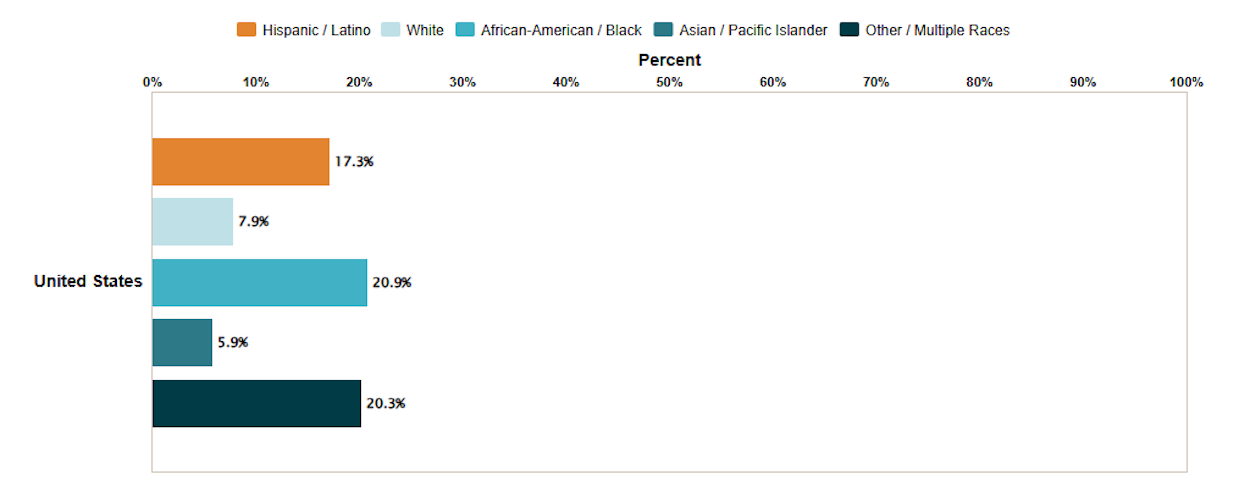
This blog post explores changes in national-level coverage rates by demographic characteristics such as age, employment, race and ethnicity, immigration status, poverty status, and Medicaid expansion status.