Percent of adults who received a flu vaccine in the past 12 months
Measure Overview
Every year, millions of Americans receive a flu vaccine (also commonly called a “flu shot”) to protect against strains of the influenza virus during flu season, which typically lasts from October to May. While not mandatory for many Americans, the flu shot can be a life-saving vaccine for people at higher risk of severe complications from influenza, such as adults age 65 and older and individuals with chronic health conditions or diseases (e.g., asthma, diabetes, cancer). Tracking flu vaccination rates in the United States can help detect gaps in vaccination coverage across different demographic groups and identify populations that are under-vaccinated against influenza.
State Health Compare provides state-level data on adult flu vaccination rates, which can be broken down by nine sub-categories: age group, chronic disease status, type of insurance, education level, household income, metropolitan status, personal doctor status, race/ethnicity, and sex. The data are based on public use files from the Behavioral Risk Factor Surveillance System (BRFSS) survey.
Generate customized graphics using this data by selecting one of the options below.
Related Products
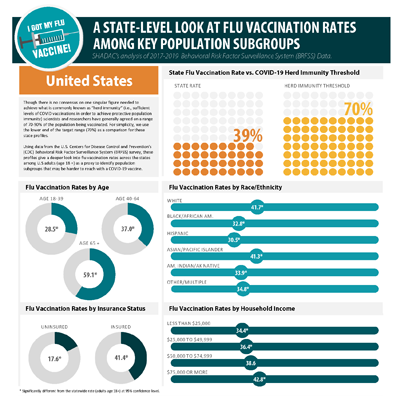
State-Level Flu Vaccination Rates Among Key Population Subgroups
These 50-state infographics provide comparisons for individual state flu vaccine rates to a COVID-19 herd immunity target, and highlight vaccination rates for by a number of demographic categories, including age, race/ethnicity, household income level, insurance status, chronic conditions, access to care, and educational attainment.
Anticipating COVID-19 Vaccination Challenges through Flu Vaccination Patterns
This brief analyzes adult flu vaccination rates for California and the United States, serving as a proxy to anticipate the challenges faced by a widespread COVID-19 vaccination campaign. The analysis examines findings across key demographics and measures of health and health care access.